Who they are
Qompass is a decision-support product designed for large enterprise groups that manage complex operations and siloed data across divisions.
10 / Case study · Qompass
Turning scattered information into a decision brief.
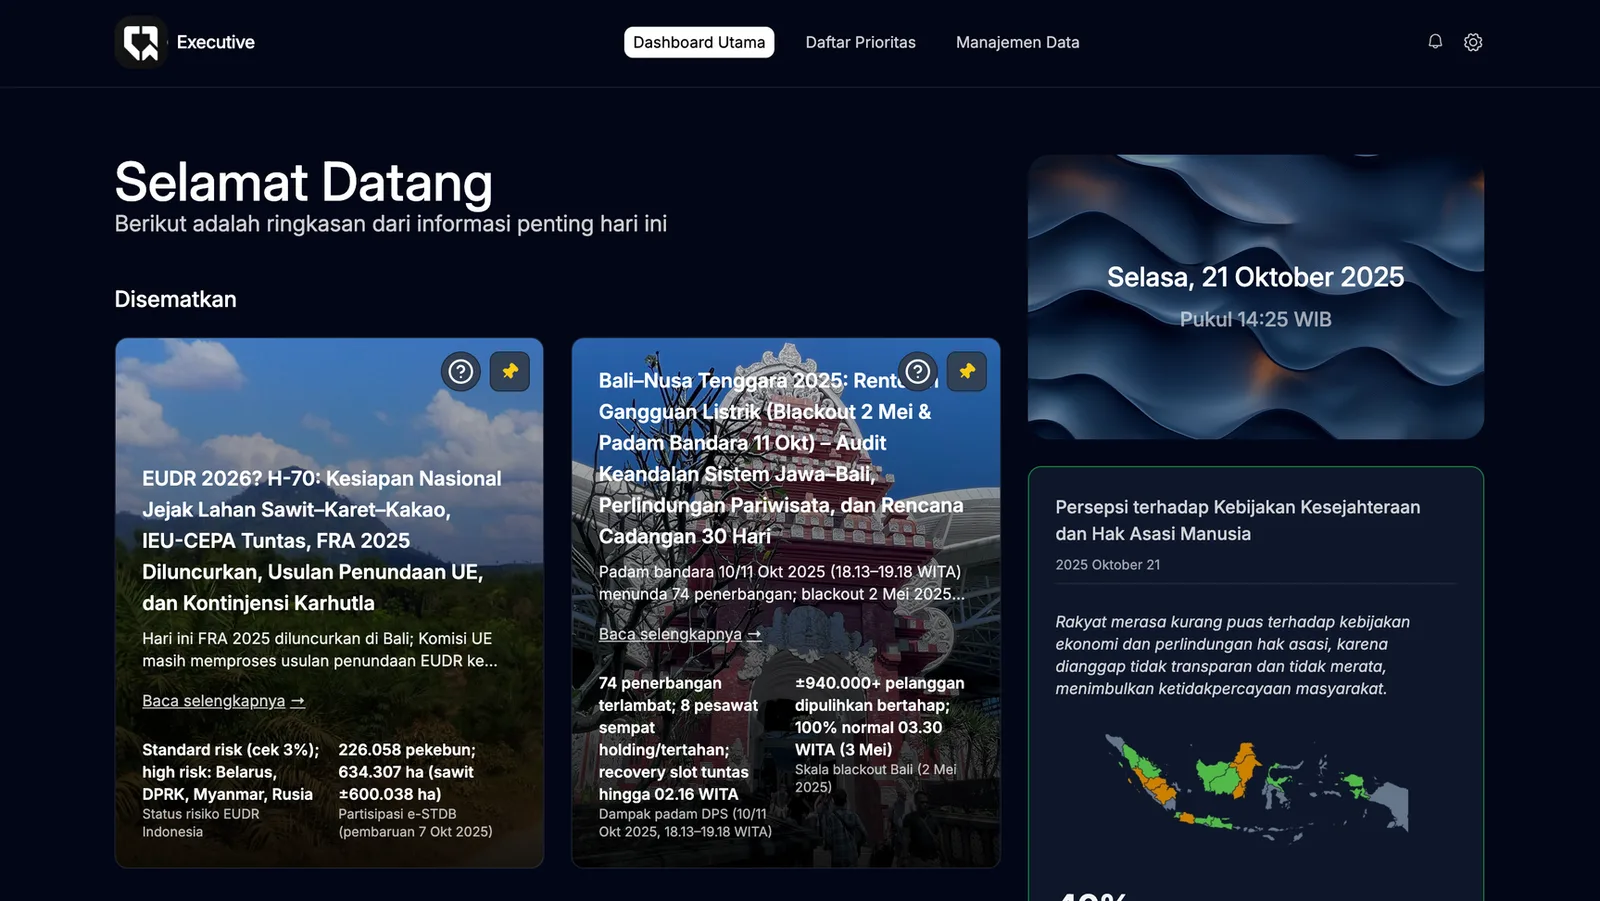
Qompass is a decision-support product designed for large enterprise groups that manage complex operations and siloed data across divisions.
Leaders wanted internal and external data consolidated into one intelligent dashboard that spots patterns, predicts issues and recommends actions with transparent reasoning.
Operational and external information was spread across divisions and sources. Leaders depended on manual reports and disconnected views, which made it harder to spot an emerging issue or see which action the data supported.
What it was costing them. Decisions stayed slow and siloed: data was scattered across divisions, procedures were inefficient and most insights arrived too late to prevent losses.
Real-time issue alerts replace manual reviews.
Automated aggregation and visualization cut manual reporting hours.
Pattern and anomaly detection feed early warnings for review.
Outcomes as recorded in the QuantumByte enterprise case-study portfolio (2025). The percentages are the engagement’s own reporting, not an independent audit.
Designed solutions
Internal operational information and external signals meet in a common dashboard.
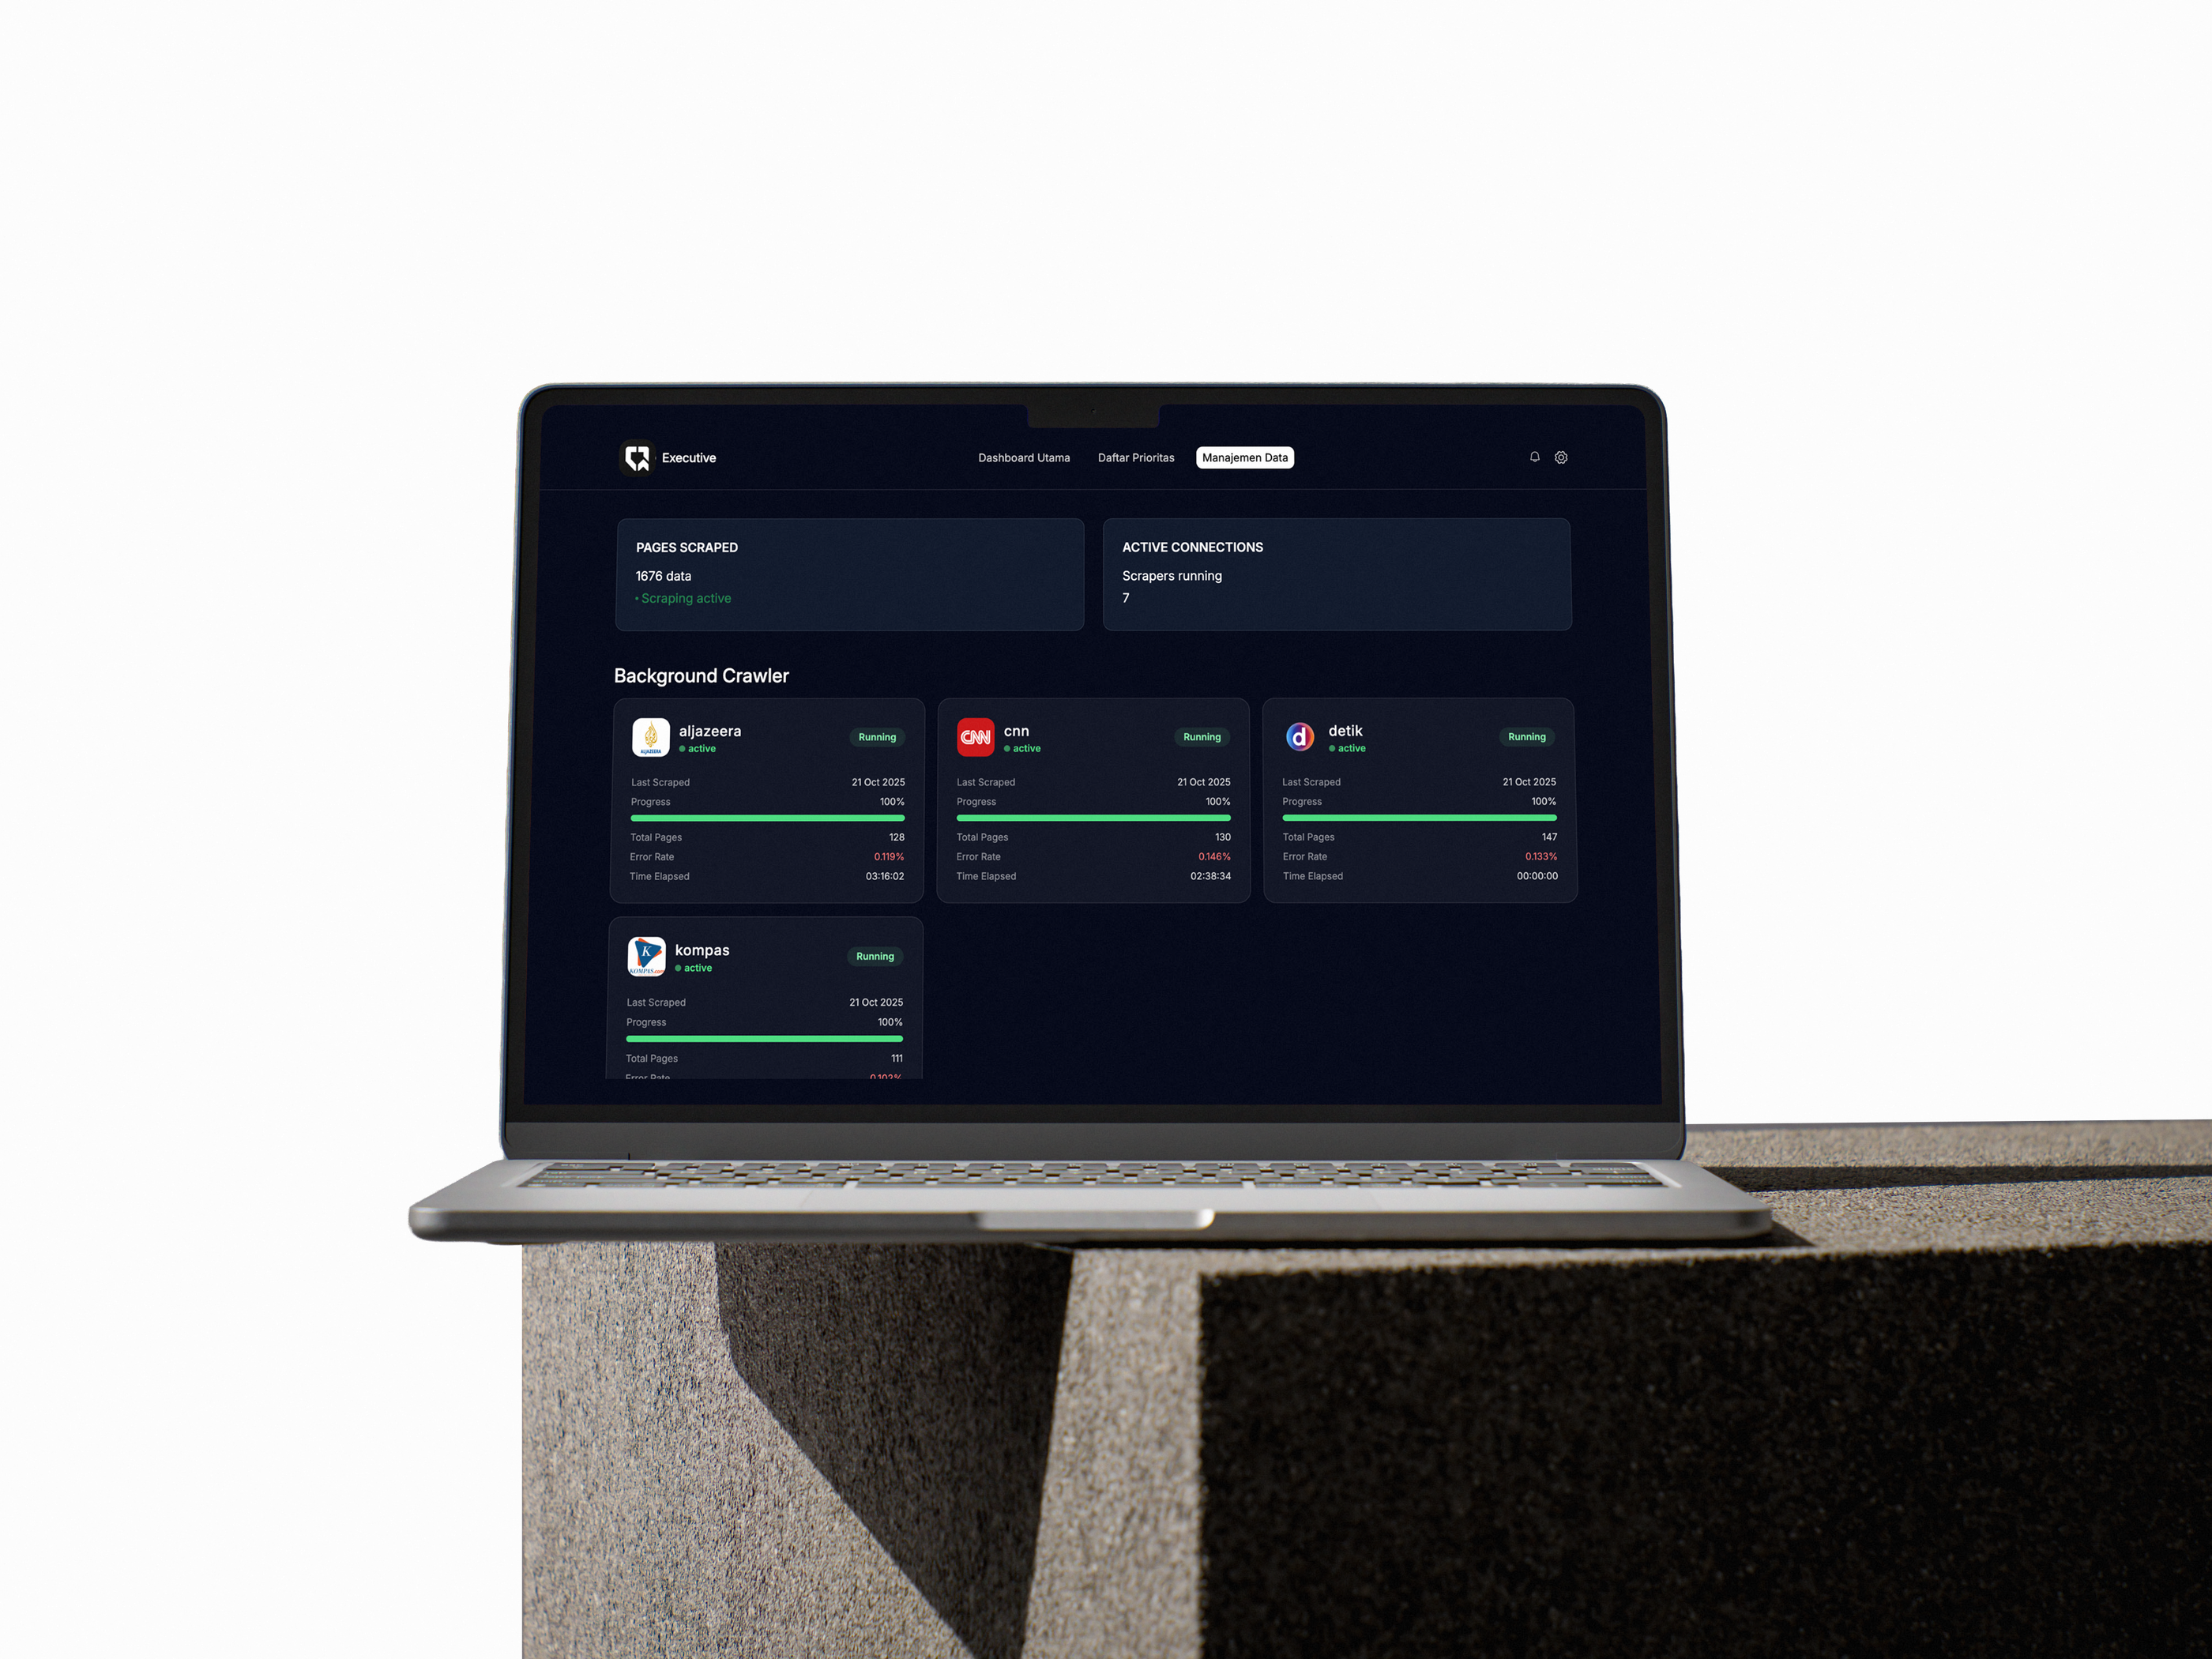
The data-management view shows source connections, crawler state and collection progress.
Pattern and anomaly detection surface issues and potential risks for review.
Recommendations turn observed patterns into proposed actions with supporting reasoning.
Tailored views bring relevant indicators and issues to leadership and individual departments.
A priority view and automated aggregation turn collected information into material for decisions.
The workflow
The team collects internal data and relevant external information.
Operators review source connections and collection status.
Leaders use the shared view to inspect patterns, anomalies and emerging risks.
They review the proposed action alongside its reasoning.
The issue moves into the appropriate leadership or departmental view.
The interfaces
Where else this applies
| Industry | Fit | Why |
|---|---|---|
| Government agencies | High | Integrating data across agencies improves oversight and policy response. |
| Energy and infrastructure | High | Tracks asset utilization, environmental risk and regional disruptions. |
| Banking and finance | High | Predictive alerts support compliance, risk exposure and fraud detection. |
| Healthcare | Medium | Monitors operational KPIs, patient flow and regulatory compliance. |
Kevin led delivery with the Quantum team: the unified data view, the recommendation design and the executive dashboards.
Tell me where the workflow breaks today and who carries it. I’ll tell you what the smallest useful slice would be, and whether I’m the right person to build it.